


DECISION SUPPORT FOR AQUACULTURE PRODUCTION

One operational picture.
Faster decisions.

EquaFish connects production data from across the site and gives operations, biology and management a single operational picture, so production can be managed more precisely and anomalies handled faster.

Monthly subscription · No lock-in

Used daily at production sites at

  • Nekton
  • Neptun Salmo
  • Sævareid Fiskeanlegg
  • Blåfjell
With EquaFish we have full control over production. We can identify trends and developments more clearly, and act before problems escalate, without spending any more time.

Maria Sørøy

Biologist, Nekton AS

How it works

One dashboard. The whole site. Real-time insight.

Get the overview in an instant, and explore the details in a few clicks. We connect to your existing systems as they are, so you get started without replacing or rebuilding anything.

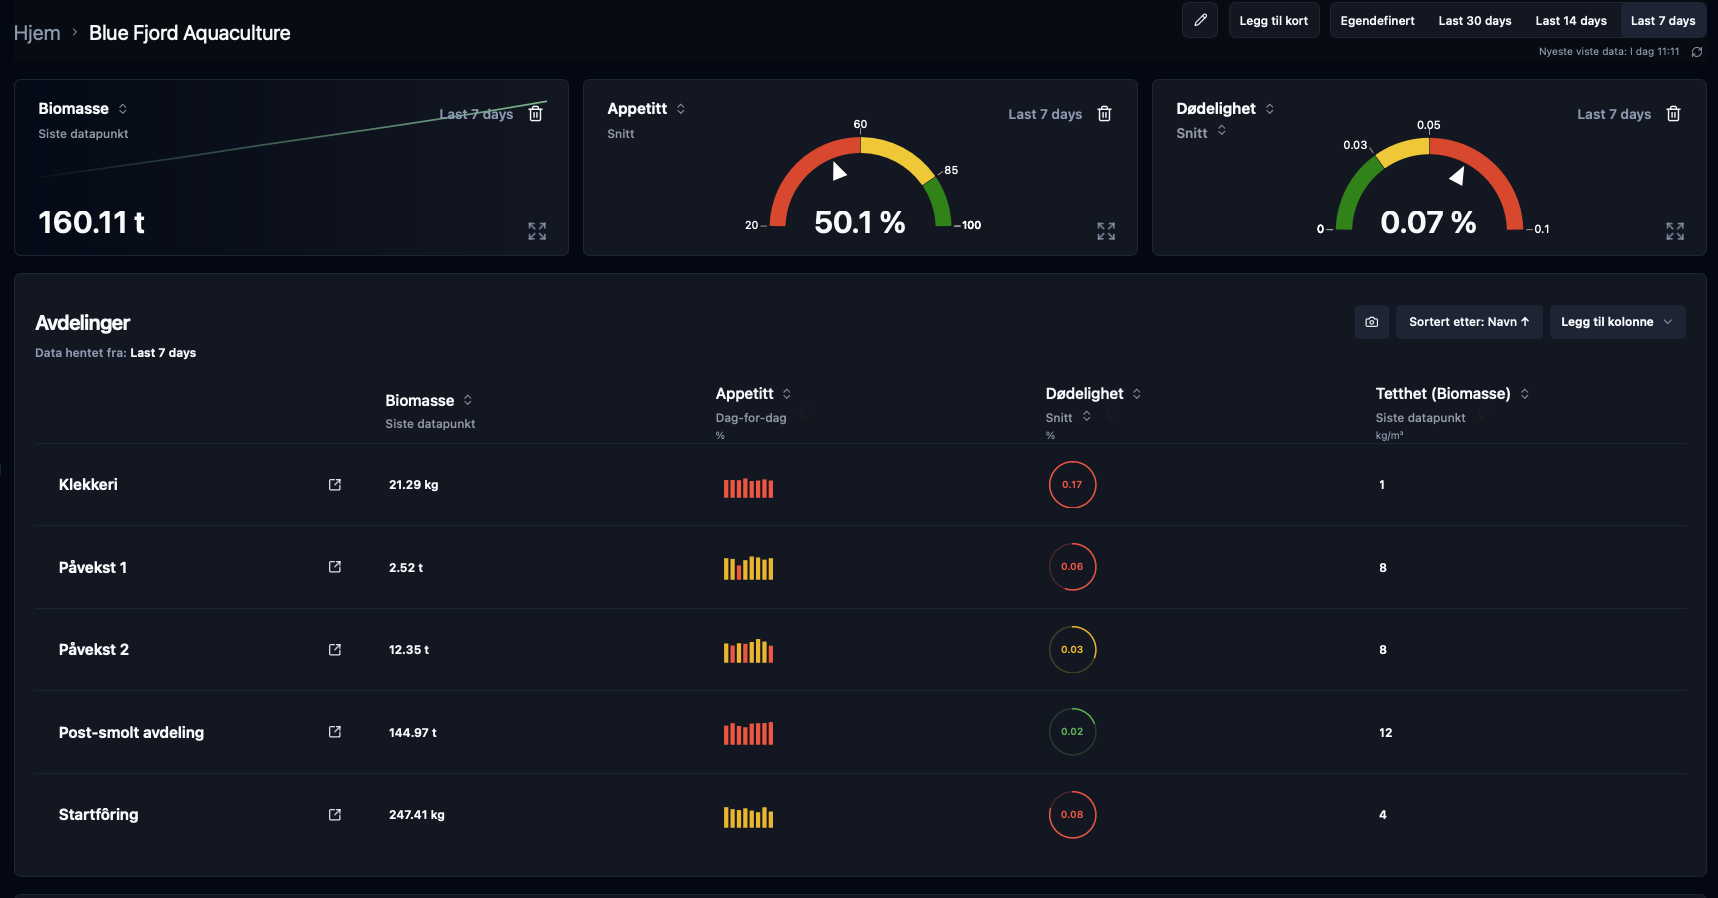
Screenshot of the EquaFish dashboard for Blue Fjord Aquaculture, last 7 days: biomass 160.11 t, appetite 50.1%, mortality 0.07%, plus per-department metrics. UI labels are in Norwegian.

Example from an active site (Blue Fjord Aquaculture), last 7 days: biomass 160.11 t, average appetite 50.1%, average mortality 0.07%.

Key metrics per department, last 7 days
DepartmentBiomass (latest reading)Mortality (avg, %)Density (kg/m³)
Hatchery21.29 kg0.17%1
Ongrowing 12.52 t0.06%8
Ongrowing 212.35 t0.03%8
Post-smolt unit144.97 t0.02%12
Start feeding247.41 kg0.08%4

Day to day, today

The data exists. It just lives everywhere.

  • Excel
  • Feeding portal
  • Sensors
  • Manual forms
  • Lab reports
  • Journals
  • Forecast sheets
  • Water quality

One production assistant. The whole site.

More oversight. More time for operations.

How it works

The questions biologists and operations leads ask every single day.

Pick a question and watch the assistant answer.

EQ

Equafish Assistant

Blue Fjord Aquaculture · All sites

Active
EQ

Equafish

Proactive alerttoday, 06:23

Mortality in Tank 6 has risen three days in a row. The pattern correlates with the temperature drop on sensor T-04 (−1.8 °C) over the past week. A similar pattern showed up in G23-V (July 2024); the dip lasted 11 days.

RECOMMENDATION Reduce feeding in Tank 6 by 15 % until temperature stabilises.
Ask the assistant, e.g. 'Where was mortality highest last week?'
Try:
See all example answers
Where was mortality highest, and what caused it?
Highest mortality over the last 30 days was in Tank 6 at 0.18 %. Three correlated factors: delousing on 12 May, temperature drop on T-04 (−1.8 °C), and 11 % higher density than recommended for the group. A similar pattern in G23-V (July 2024) lasted 11 days, with faster recovery when feeding was reduced early.
Why is Grow-out 2 behind plan?
Growth in Grow-out 2 is 12 % below plan this week. Three factors stand out: lower appetite after delousing on 14 May (60 % vs. 78 %), temperature 0.8 °C below forecast, and FCR up from 1.04 to 1.12. Comparing with 8 similar generations: expected recovery is 2-3 weeks without intervention.
Which feed and protocol performed best on the last generation?
On G24-V (stocked March 2024, harvested October 2024) Spirit 9 mm gave the best result: SGR 0.98 vs. 0.89 average for the period, and FCR 1.03 vs. 1.11. The margin was largest at sea temperatures below 8 °C. Consider the same feed on G25-V if the temperature profile is similar.

Use cases

Six things you do better with the assistant.

  • 01 · COLLECT

    Surface what's hiding in your production data

    Your data is scattered across feeding portals, sensor logs, journals and spreadsheets. The assistant brings it all into one place, so you can see relationships that were invisible when the sources were separated.

  • 02 · TROUBLESHOOT

    Get from problem to action, faster

    Something is off, but what? The assistant connects the anomaly with historical patterns, sensor data and similar episodes from previous generations. You get the root cause and concrete actions, not just an alert.

  • 03 · PLAN

    Plan ahead. Track against plan and goals

    See actual production against plan, per site, per generation, per week. The forecasting tool lets you simulate harvest volume, density and biomass forward, and adjust the plan when conditions change.

  • 04 · DECIDE

    Make decisions based on data, not assumptions.

    Simulate the consequences of different actions before they are put into practice. Understand how changes to the feeding plan affect biomass and growth, before you act.

    Scenario A

    Scenario B ✓

  • 05 · COLLABORATE

    When everyone sees the same picture, the discussion gets better

    Biologist, operations lead and management work in the same tool with the same data. Meetings are about decisions, not about agreeing what the numbers actually say.

    B
    D
    L
    Samme dashboard.
    Samme tall.
  • 06 · LEARN

    Make the site smarter year over year

    Experience from each generation is captured and used actively. Next time something similar happens, the assistant knows what worked last time, at your site, with your species, and your setup.

From scattered spreadsheets to full overview

Without EquaFish

  • Data is spread across four systems and several spreadsheets, and you constantly switch between screens.
  • The same numbers have to be entered manually in several places.
  • The weekly report takes almost a full workday to put together.
  • Deviations are spotted late, and you get an alert without a cause.
  • Decisions are made on gut feel because the numbers aren't ready in time.
VS

With EquaFish

  • All production data in one place. We connect to the systems you already use.
  • Data is pulled automatically, with no double entry.
  • Key figures and reports are ready continuously, not as a full-day job.
  • Deviations are linked to historical patterns, so you get root cause and concrete actions.
  • Decisions based on data. Simulate the consequences before you act.

Get started

From first meeting to full operation in four weeks.

  1. 1Week 1

    Free setup

    We set up EquaFish against the systems you already use. All you do is give us access.

  2. 2Week 2-4

    Pilot at one site

    You test with your own numbers, in your own operation. Full functionality, unlimited users.

  3. 3

    You decide

    If it works, you continue with a fixed monthly price based on the number of sites.

Simple, flexible pricing

Monthly subscription scaled to operations and number of sites

Everything included

  • Full access to all features
  • Integrations with your systems: Fishtalk, Mercatus and more
  • Unlimited users
  • Support, training and updates

How pricing works

  • One fixed monthly price, no modules, no add-ons
  • Pricing follows the number of sites and production volume
  • No lock-in, no setup fee
  • Annual review, new needs are handled there

Start with the pilot.

We connect, you log in. A complete setup from day one, with your entire production history in place.

Common questions.

Ready to meet your new production assistant?

We'll set up a 20-minute demo tailored to your production, with your own numbers if you'd like.

Book a meeting with us

We'll set up a 20-minute demo tailored to your production.

Book a demo

…or email us at eirik@equafish.com